


Learn how to identify, investigate, and manage Out-of-Trend (OOT) results in stability studies using CAPA, GMP principles, and risk-based approaches.
Definition
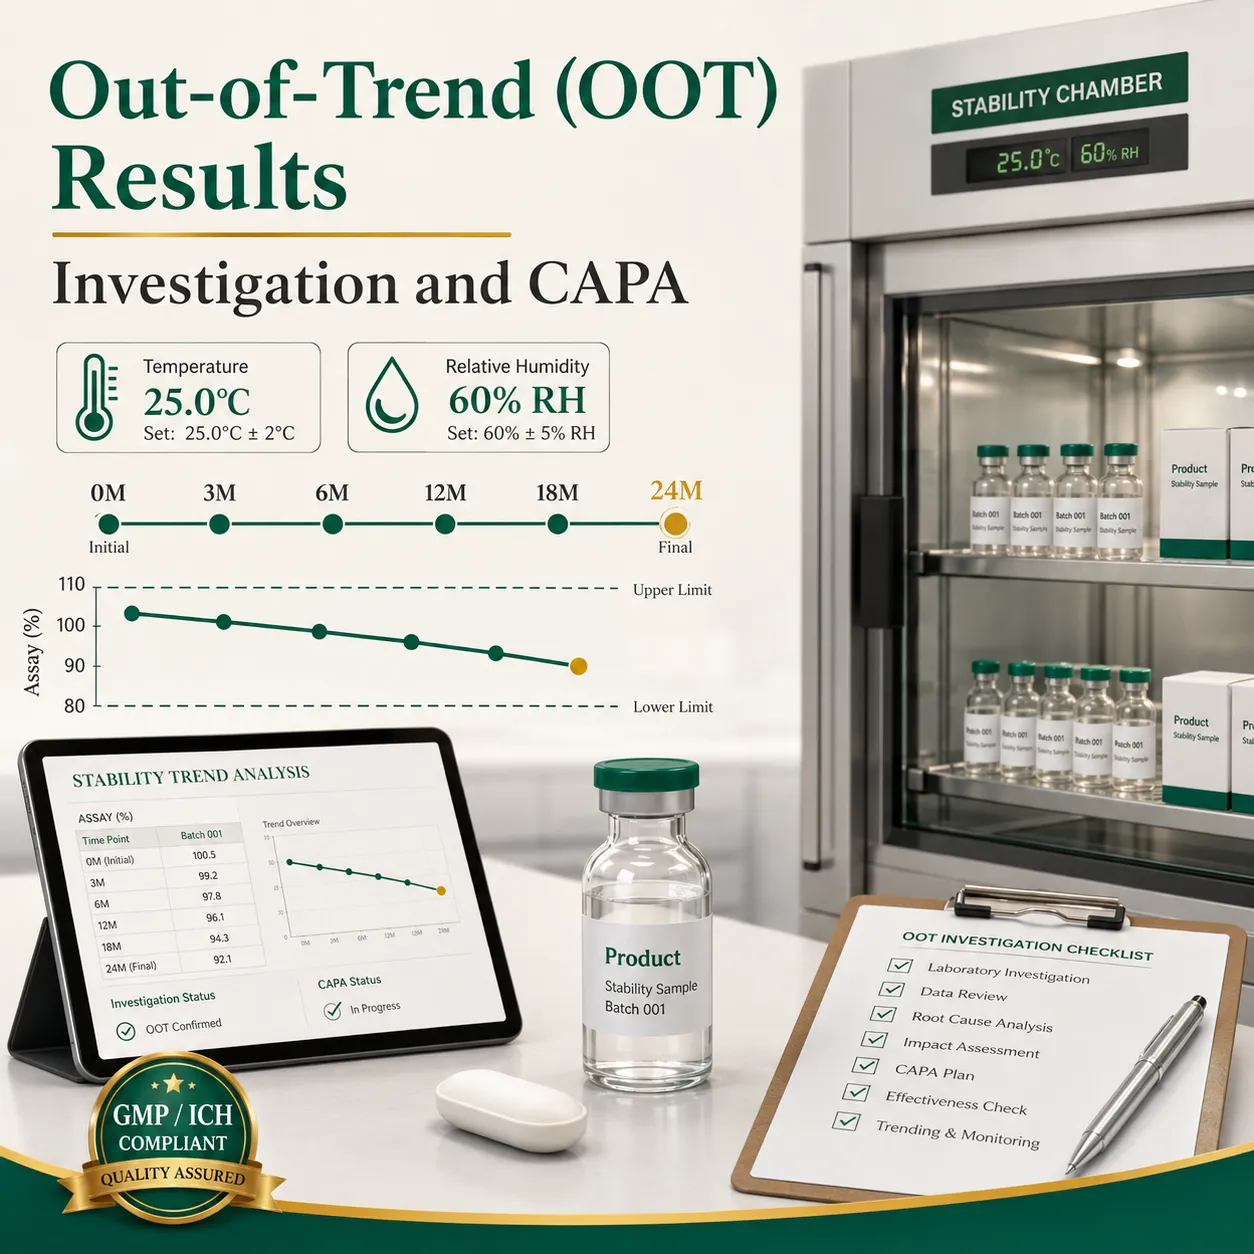
An Out-of-Trend (OOT) result in stability studies is a test result that remains within specification limits but deviates significantly from the expected historical trend or degradation pattern. OOT investigations help identify potential product quality issues before they become Out-of-Specification (OOS) failures and support timely corrective and preventive actions (CAPA) to maintain product stability and patient safety.
Introduction
Stability studies are a critical component of pharmaceutical product lifecycle management. They demonstrate that a drug product maintains its identity, strength, quality, purity, and performance throughout its shelf life under defined storage conditions.
While Out-of-Specification (OOS) results receive significant regulatory attention, Out-of-Trend (OOT) results are often the earliest warning signs of potential stability problems. A product may still meet specifications, yet its assay, dissolution, impurity, or degradation profile may begin drifting away from historical expectations.
Detecting and investigating OOT results allows pharmaceutical companies to identify emerging quality risks, prevent future failures, maintain regulatory compliance, and protect patients.
This article explains how OOT results are identified, investigated, assessed, and managed through effective CAPA programs within GMP-compliant stability studies.
What Is an Out-of-Trend (OOT) Result?
An OOT result occurs when a stability test result shows an unexpected change compared with historical data or established degradation patterns, even though the result remains within specification limits.
Example
| Parameter | Previous Trend | Current Result | Specification | OOT Status |
|---|---|---|---|---|
| Assay (%) | 99.2 → 98.8 → 98.4 | 94.8 | 90.0–110.0 | Yes |
| Total Impurities (%) | 0.15 → 0.20 → 0.25 | 0.60 | NMT 1.0% | Yes |
| Dissolution (%) | 96 → 95 → 94 | 85 | NLT 80% | Yes |
Although all results meet specifications, the sudden deviation indicates abnormal product behavior requiring investigation.
OOT vs OOS: Understanding the Difference
| Criteria | OOT Result | OOS Result |
|---|---|---|
| Within Specification? | Yes | No |
| Regulatory Concern | High | Critical |
| Indicates Trend Shift? | Yes | Not necessarily |
| Requires Investigation? | Yes | Mandatory |
| Potential Product Impact | Future failure risk | Immediate quality concern |
| CAPA Requirement | Usually | Always |
OOT investigations often prevent future OOS events by identifying issues at an early stage.
Why OOT Investigations Are Important
Effective OOT management helps organizations:
- Detect product degradation early
- Identify manufacturing variability
- Improve process robustness
- Prevent shelf-life failures
- Maintain GMP compliance
- Strengthen quality systems
- Reduce product recalls
- Enhance patient safety
How OOT Results Are Identified
OOT determination relies on evaluating historical trends rather than isolated data points.
1. Regression Analysis
Regression models monitor expected degradation rates across batches.
Example
Historical assay trend:
| Month | Assay (%) |
|---|---|
| 0 | 100.0 |
| 3 | 99.5 |
| 6 | 99.0 |
| 9 | 98.5 |
| 12 | 98.0 |
Expected 18-month assay = 97.0%
Actual 18-month assay = 93.5%
Result remains within specification but significantly deviates from the regression model, triggering an OOT investigation.
2. Control Chart Analysis
Control charts compare results against statistical control limits.
Parameters monitored include:
- Assay
- Dissolution
- Water content
- Degradation products
- Impurities
Indicators of OOT
- Sudden shift from historical average
- Consecutive points trending in one direction
- Values approaching control limits
- Unexpected spikes or drops
3. Time-Point Comparisons
Organizations often establish predefined alert criteria.
Example
| Parameter | Alert Criterion |
|---|---|
| Assay | >5% drop from previous interval |
| Dissolution | >10% reduction |
| Total Impurities | >2× expected increase |
| Water Content | Significant unexplained increase |
Step-by-Step OOT Investigation Process
Step 1: Identify and Document the OOT
Immediately document:
- Product name
- Batch number
- Stability condition
- Test parameter
- Trend deviation observed
- Investigation initiation date
Documentation Requirements
- Stability protocol reference
- Raw analytical data
- Chromatograms
- Calculations
- Trend charts
Step 2: Conduct Preliminary Laboratory Investigation
The first objective is determining whether the result is caused by analytical error.
Actions
Notify Management
The analyst informs:
- Laboratory supervisor
- Stability coordinator
- Quality Assurance
Preserve Samples
Retain:
- Original solutions
- Reference standards
- Stability samples
Review Documentation
Evaluate:
| Area | Review Items |
|---|---|
| Data Integrity | Audit trail, worksheets |
| Calculations | Formula accuracy |
| Instruments | Calibration status |
| Method | Compliance with SOP |
| Analyst | Training records |
Step 3: Evaluate Potential Laboratory Errors
Common laboratory causes include:
- Incorrect sample preparation
- Instrument malfunction
- Standard degradation
- Calculation mistakes
- Integration errors
- Data transcription errors
Hypothesis Testing
If laboratory error is suspected:
- Establish scientific rationale.
- Define investigation hypothesis.
- Conduct justified retesting.
- Compare results.
Retesting must follow approved procedures and GMP requirements.
Step 4: Manufacturing and Stability Evaluation
If laboratory error is ruled out, investigate manufacturing and storage factors.
Historical Batch Review
Analyze:
- Stability profiles
- Manufacturing records
- Batch genealogy
- Change controls
- Deviation history
Step 5: Perform Root Cause Analysis (RCA)
Several tools are commonly used.
Fishbone Diagram Categories
| Category | Potential Causes |
|---|---|
| Materials | Raw material variability |
| Methods | Process changes |
| Machines | Equipment performance |
| Manpower | Operator errors |
| Environment | Temperature excursions |
| Measurement | Analytical issues |
5-Whys Example
Issue: Unexpected impurity increase.
Why? → Degradation accelerated.
Why? → Higher moisture exposure.
Why? → Packaging seal weakness.
Why? → Sealing equipment variation.
Why? → Preventive maintenance overdue.
Root Cause: Inadequate maintenance program.
Impact Assessment of Confirmed OOT Results
Once a genuine trend shift is confirmed, assess product impact.
Areas to Evaluate
Current Batch
Determine whether the batch can remain within specifications until expiry.
Released Batches
Review previously distributed lots.
Future Batches
Assess risk of recurring issues.
Shelf-Life Impact
Determine whether:
- Existing shelf life remains valid
- Additional stability testing is needed
- Expiry dating requires revision
Practical Example: OOT Assay Result
Scenario
A tablet product shows:
| Time Point | Assay (%) |
|---|---|
| Initial | 100.0 |
| 6 Months | 99.0 |
| 12 Months | 98.0 |
| 18 Months | 97.0 |
| 24 Months | 92.0 |
Specification: 90–110%
Observation
Result remains compliant but demonstrates accelerated degradation compared with historical batches.
Investigation Outcome
Root Cause:
- Higher API moisture content from a supplier lot.
Corrective Action
- Quarantine affected material.
- Increase incoming moisture testing.
Preventive Action
- Revise supplier qualification program.
- Tighten raw material specifications.
CAPA for OOT Results
A robust CAPA program prevents recurrence and strengthens product quality.
Corrective Actions
Address immediate issues.
Examples:
- Quarantine affected batches
- Recalibrate equipment
- Replace defective components
- Adjust storage conditions
- Increase monitoring frequency
Preventive Actions
Eliminate future recurrence.
Examples:
- SOP revisions
- Additional analyst training
- Supplier qualification improvements
- Enhanced process controls
- Stability protocol updates
CAPA Effectiveness Verification
Verify that actions successfully resolved the issue.
Monitoring Activities
- Trend future stability data
- Conduct follow-up audits
- Review process capability
- Perform periodic quality reviews
GMP and Regulatory Expectations
FDA Expectations
Although FDA guidance focuses primarily on OOS investigations, firms are expected to monitor trends that could indicate emerging quality problems.
Relevant references include:
- 21 CFR Part 211
- FDA Guidance for Industry: Investigating OOS Test Results
- FDA Process Validation Guidance
ICH Guidelines
ICH Q1A(R2)
Requires evaluation of stability trends to establish shelf life.
ICH Q9
Supports risk-based assessment of quality issues.
ICH Q10
Requires effective CAPA and continual improvement systems.
EU GMP Expectations
EU GMP Chapter 1 and Chapter 6 emphasize:
- Trend analysis
- Investigation of atypical results
- Product Quality Review (PQR)
- Ongoing process verification
Best Practices for Managing OOT Results
✓ Establish statistical trend limits
✓ Review stability data routinely
✓ Use control charts and regression analysis
✓ Investigate deviations promptly
✓ Maintain complete documentation
✓ Apply scientific risk assessment
✓ Implement effective CAPA
✓ Verify CAPA effectiveness
✓ Integrate OOT review into PQR
✓ Train staff on trend analysis
Common Mistakes to Avoid
| Mistake | Risk |
|---|---|
| Ignoring trend shifts | Future OOS failures |
| Retesting without rationale | Data integrity concerns |
| Weak RCA | Recurrence of issues |
| Poor documentation | Regulatory observations |
| No effectiveness checks | Ineffective CAPA |
| Delayed investigations | Increased business risk |
FAQs
1. What is an OOT result in stability studies?
An OOT result is a test result that remains within specifications but deviates significantly from the expected historical trend.
2. How is OOT different from OOS?
OOT results are within specification limits, while OOS results fall outside approved specifications.
3. Which parameters commonly show OOT trends?
Assay, dissolution, impurities, degradation products, water content, and appearance.
4. Why are OOT investigations important?
They identify potential quality issues before they become product failures or OOS events.
5. How are OOT results detected?
Using trend analysis, regression models, control charts, and historical comparisons.
6. Does FDA require OOT investigations?
While FDA guidance focuses on OOS, GMP regulations expect manufacturers to evaluate abnormal trends.
7. What is the first step in an OOT investigation?
Document the event and conduct a laboratory investigation to rule out analytical errors.
8. Can an OOT result affect shelf life?
Yes. A confirmed trend shift may require reassessment of expiry dating and stability commitments.
9. What root cause tools are used for OOT investigations?
Fishbone diagrams, 5-Whys analysis, fault tree analysis, and risk assessments.
10. What CAPA actions are commonly implemented after OOT findings?
SOP revisions, training, process improvements, supplier controls, equipment maintenance, and enhanced monitoring.