


Learn method validation parameters including accuracy, precision, linearity, LOD, LOQ, and robustness with pharma examples and ICH guidance.
Definition
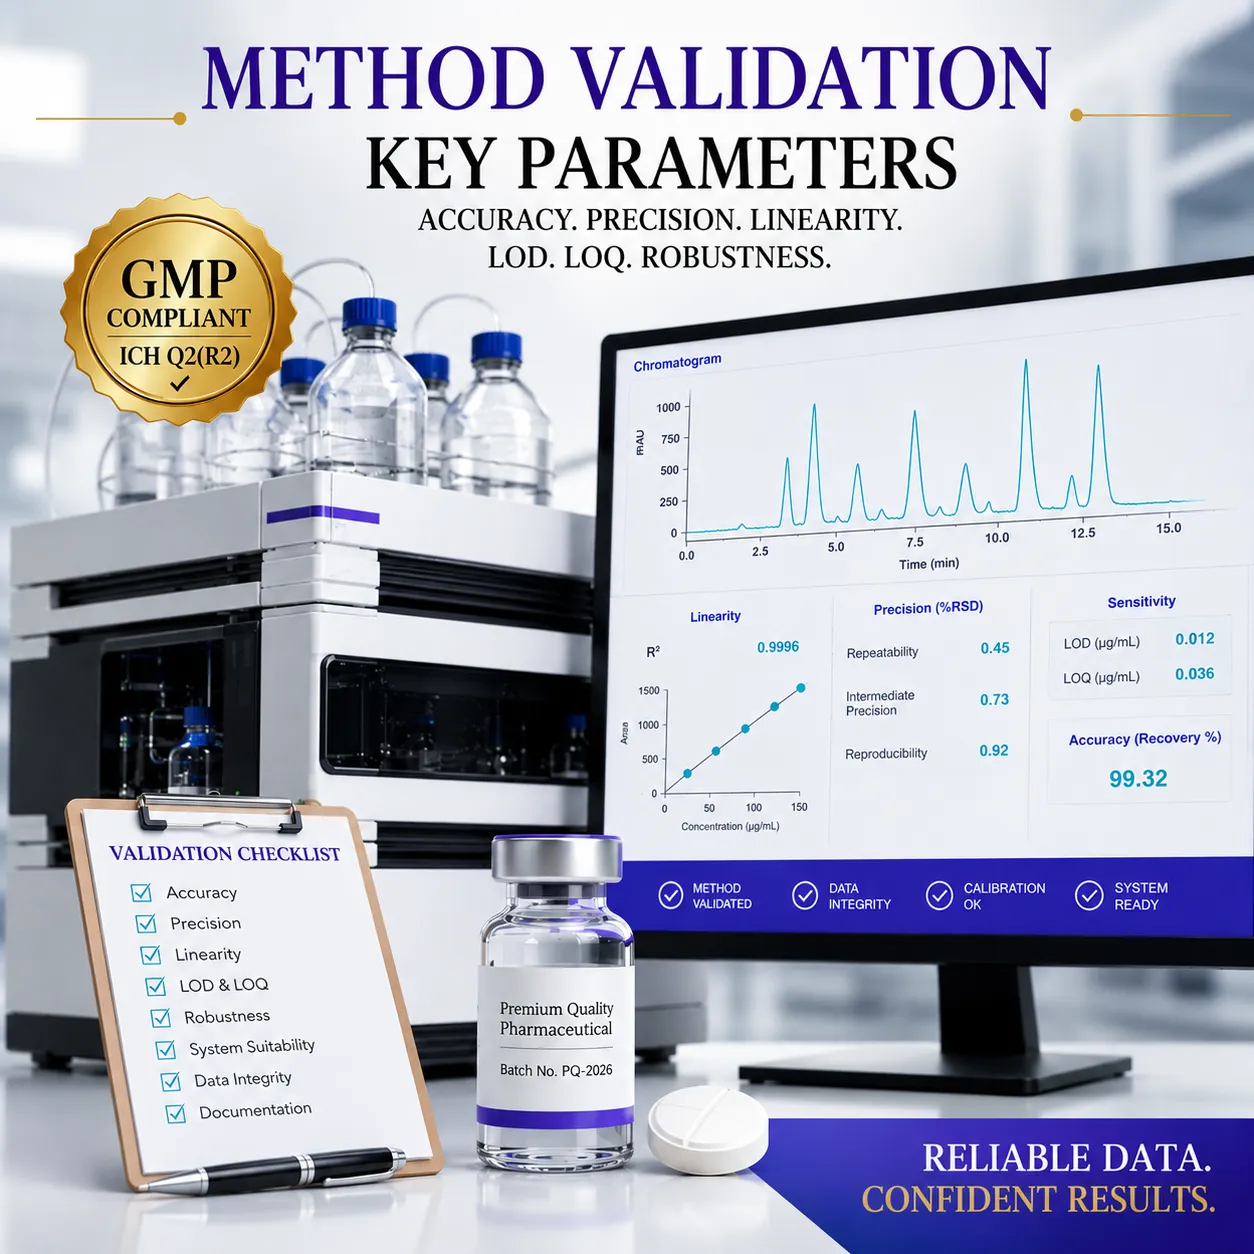
Method validation is the documented process of demonstrating that an analytical procedure is suitable for its intended purpose and consistently produces reliable, accurate, and reproducible results. Key validation parameters include accuracy, precision, linearity, limit of detection (LOD), limit of quantitation (LOQ), specificity, range, and robustness, as defined by ICH Q2(R2) guidelines.
Introduction
Analytical testing serves as the backbone of pharmaceutical quality control. Whether performing assay testing, impurity profiling, dissolution studies, or stability analysis, laboratories must ensure that analytical results are scientifically reliable and regulatory compliant.
This is where method validation becomes critical.
Method validation demonstrates that an analytical procedure consistently produces accurate, precise, and reproducible results within predefined acceptance criteria. Regulatory agencies such as the FDA, EMA, MHRA, and WHO require validated analytical methods before they can be used for product release, stability testing, and regulatory submissions.
This article explains the most important validation parameters—Accuracy, Precision, Linearity, LOD, LOQ, and Robustness—along with practical examples, GMP expectations, and current regulatory guidance.
What Is Method Validation?
Method validation is the process of proving that an analytical procedure is reliable, scientifically sound, and fit for its intended purpose.
Validation establishes:
- Method performance characteristics
- Acceptable operating ranges
- Reliability of analytical results
- Regulatory compliance
- Data integrity assurance
Why Method Validation Is Important
Benefits of Validation
| Benefit | Impact |
|---|---|
| Reliable Results | Increased confidence in data |
| Regulatory Compliance | Meets FDA, EMA, WHO expectations |
| Product Quality | Supports accurate release decisions |
| Risk Reduction | Minimizes analytical errors |
| Inspection Readiness | Demonstrates scientific control |
| Data Integrity | Ensures trustworthy records |
Overview of Method Validation Parameters
| Parameter | Purpose |
|---|---|
| Accuracy | Closeness to true value |
| Precision | Consistency of results |
| Linearity | Proportional response across concentration range |
| LOD | Lowest detectable amount |
| LOQ | Lowest quantifiable amount |
| Robustness | Resistance to small method changes |
| Specificity | Ability to measure analyte without interference |
| Range | Working concentration interval |
1. Accuracy
What Is Accuracy?
Accuracy measures how close the analytical result is to the true or accepted reference value.
In simple terms:
Accuracy answers the question: “Is the method giving the correct result?”
How Accuracy Is Evaluated
Typically assessed through recovery studies.
Formula
% Recovery = (Measured Value ÷ True Value) × 100
Example
A known standard contains 100 mg of API.
The method reports:
- 99.2 mg
- 100.4 mg
- 100.1 mg
Recovery Results
| Result | Recovery (%) |
|---|---|
| 99.2 mg | 99.2 |
| 100.4 mg | 100.4 |
| 100.1 mg | 100.1 |
Average recovery demonstrates excellent accuracy.
Typical Acceptance Criteria
| Method Type | Typical Recovery |
|---|---|
| Assay | 98–102% |
| Impurities | 80–120% |
| Dissolution | Method-specific |
2. Precision
What Is Precision?
Precision measures the closeness of agreement among a series of measurements obtained from multiple samplings of the same sample.
Precision answers:
“Can the method consistently produce the same result?”
Types of Precision
Repeatability
Same analyst, same instrument, same day.
Intermediate Precision
Different analysts, instruments, or days within the same laboratory.
Reproducibility
Different laboratories evaluate the same method.
Precision Calculation
Measured using:
% Relative Standard Deviation (%RSD)
%RSD = (Standard Deviation ÷ Mean) × 100
Example
Assay results:
99.8%, 100.2%, 99.9%, 100.1%, 100.0%, 99.7%
Result
Mean = 99.95%
%RSD = 0.18%
The method demonstrates excellent precision.
Typical Acceptance Criteria
| Test Type | Acceptance |
|---|---|
| Assay | ≤ 2.0% RSD |
| Dissolution | ≤ 5.0% RSD |
| Impurities | Method dependent |
3. Linearity
What Is Linearity?
Linearity evaluates whether analytical responses are directly proportional to analyte concentration over a specified range.
Why It Matters
A linear method allows accurate quantification across varying concentrations.
Example
| Concentration (%) | Response |
|---|---|
| 50 | 512 |
| 75 | 763 |
| 100 | 1018 |
| 125 | 1272 |
| 150 | 1524 |
Linear regression analysis produces:
R² = 0.9998
This indicates excellent linearity.
Typical Acceptance Criteria
| Parameter | Acceptance |
|---|---|
| Correlation Coefficient (R²) | ≥ 0.999 |
| Y-Intercept | Scientifically justified |
| Residuals | Random distribution |
4. Limit of Detection (LOD)
What Is LOD?
LOD is the lowest amount of analyte that can be reliably detected but not necessarily quantified.
LOD answers:
“Can the analyte be detected?”
Common Determination Methods
Signal-to-Noise Approach
Signal-to-noise ratio:
3:1
Practical Example
Impurity concentration:
0.005%
Peak visible and distinguishable from baseline noise.
Result:
Method can detect the impurity.
Typical Applications
- Impurity testing
- Residual solvent analysis
- Trace contaminant detection
5. Limit of Quantitation (LOQ)
What Is LOQ?
LOQ represents the lowest concentration that can be quantified with acceptable accuracy and precision.
LOQ answers:
“Can the analyte be measured accurately?”
Signal-to-Noise Approach
Typical ratio:
10:1
Example
Impurity level:
0.015%
Measured with:
- Recovery within limits
- Precision within limits
Result:
Concentration qualifies as LOQ.
Difference Between LOD and LOQ
| Parameter | LOD | LOQ |
|---|---|---|
| Detect | Yes | Yes |
| Quantify Accurately | No | Yes |
| Typical S/N Ratio | 3:1 | 10:1 |
6. Robustness
What Is Robustness?
Robustness measures the ability of a method to remain unaffected by small, deliberate changes in analytical conditions.
Why Robustness Matters
Laboratories operate under slightly varying conditions.
A robust method continues to perform reliably despite minor changes.
Examples of Deliberate Changes
| Parameter | Typical Variation |
|---|---|
| Flow Rate | ±10% |
| Column Temperature | ±5°C |
| Mobile Phase pH | ±0.2 units |
| Detection Wavelength | ±2 nm |
| Organic Phase Composition | ±2% |
Example
HPLC assay evaluated at:
- Flow rate 1.0 mL/min
- Flow rate 1.1 mL/min
- Flow rate 0.9 mL/min
If system suitability remains acceptable, robustness is demonstrated.
Step-by-Step Method Validation Process
Step 1: Develop Validation Protocol
Define:
- Scope
- Acceptance criteria
- Parameters
- Statistical approach
Step 2: Perform Specificity Studies
Demonstrate absence of interference.
Step 3: Evaluate Accuracy
Conduct recovery studies at multiple levels.
Step 4: Assess Precision
Perform replicate testing.
Step 5: Establish Linearity and Range
Generate calibration curves.
Step 6: Determine LOD and LOQ
Use statistical or signal-to-noise methods.
Step 7: Conduct Robustness Studies
Challenge critical method parameters.
Step 8: Prepare Validation Report
Document:
- Results
- Statistical evaluation
- Deviations
- Conclusions
Practical HPLC Assay Validation Example
Product
Paracetamol Tablets 500 mg
Method
RP-HPLC Assay
Validation Results
| Parameter | Result |
|---|---|
| Accuracy | 99.6% Recovery |
| Precision | 0.42% RSD |
| Linearity | R² = 0.9999 |
| LOD | 0.004% |
| LOQ | 0.012% |
| Robustness | Passed |
| Specificity | No interference |
Conclusion
Method validated and suitable for routine QC testing.
GMP and Regulatory Insights
Key Regulatory References
ICH Guidelines
- ICH Q2(R2): Validation of Analytical Procedures
- ICH Q14: Analytical Procedure Development
USP
- USP <1225>
- USP <1226>
FDA
- Analytical Procedures and Methods Validation Guidance
WHO
- WHO Technical Report Series Guidelines
Common FDA Inspection Findings
- Incomplete validation studies
- Inadequate robustness assessments
- Unsupported acceptance criteria
- Poor statistical analysis
- Lack of method lifecycle management
Best Practices for Successful Validation
✔ Use approved protocols
✔ Follow ICH Q2(R2)
✔ Apply risk-based approaches
✔ Validate lifecycle performance
✔ Perform robust statistical evaluation
✔ Document all activities contemporaneously
✔ Maintain complete traceability
✔ Review validation data independently
Conclusion
Method validation is a fundamental requirement for pharmaceutical quality control and regulatory compliance. By thoroughly evaluating accuracy, precision, linearity, LOD, LOQ, and robustness, laboratories can demonstrate that analytical methods consistently produce reliable and scientifically defensible results.
Following ICH Q2(R2), ICH Q14, USP, and FDA guidance ensures analytical procedures remain fit for purpose throughout their lifecycle, supporting product quality, patient safety, and regulatory confidence.
FAQs
1. What is method validation in pharmaceuticals?
Method validation demonstrates that an analytical procedure is suitable for its intended purpose and consistently produces reliable results.
2. What are the main validation parameters?
Accuracy, precision, specificity, linearity, range, LOD, LOQ, and robustness.
3. What is the difference between accuracy and precision?
Accuracy measures closeness to the true value, while precision measures consistency among repeated measurements.
4. What is an acceptable R² value for linearity?
Most pharmaceutical methods require an R² value of at least 0.999.
5. What is the difference between LOD and LOQ?
LOD detects the analyte, while LOQ quantifies it with acceptable accuracy and precision.
6. Why is robustness important?
Robustness demonstrates that minor method variations do not significantly affect results.
7. Which guideline governs method validation?
ICH Q2(R2) is the primary international guideline for analytical method validation.
8. How is precision calculated?
Using standard deviation and percent relative standard deviation (%RSD).
9. What is a recovery study?
A study used to evaluate method accuracy by comparing measured values to known amounts added.
10. Why do regulators inspect validation studies?
To ensure analytical methods are scientifically sound and produce reliable quality data.