


Learn how LC-MS/MS chromatography detects PFAS in drinking water, supports regulatory compliance, and enables ultra-trace environmental analysis.
Definition
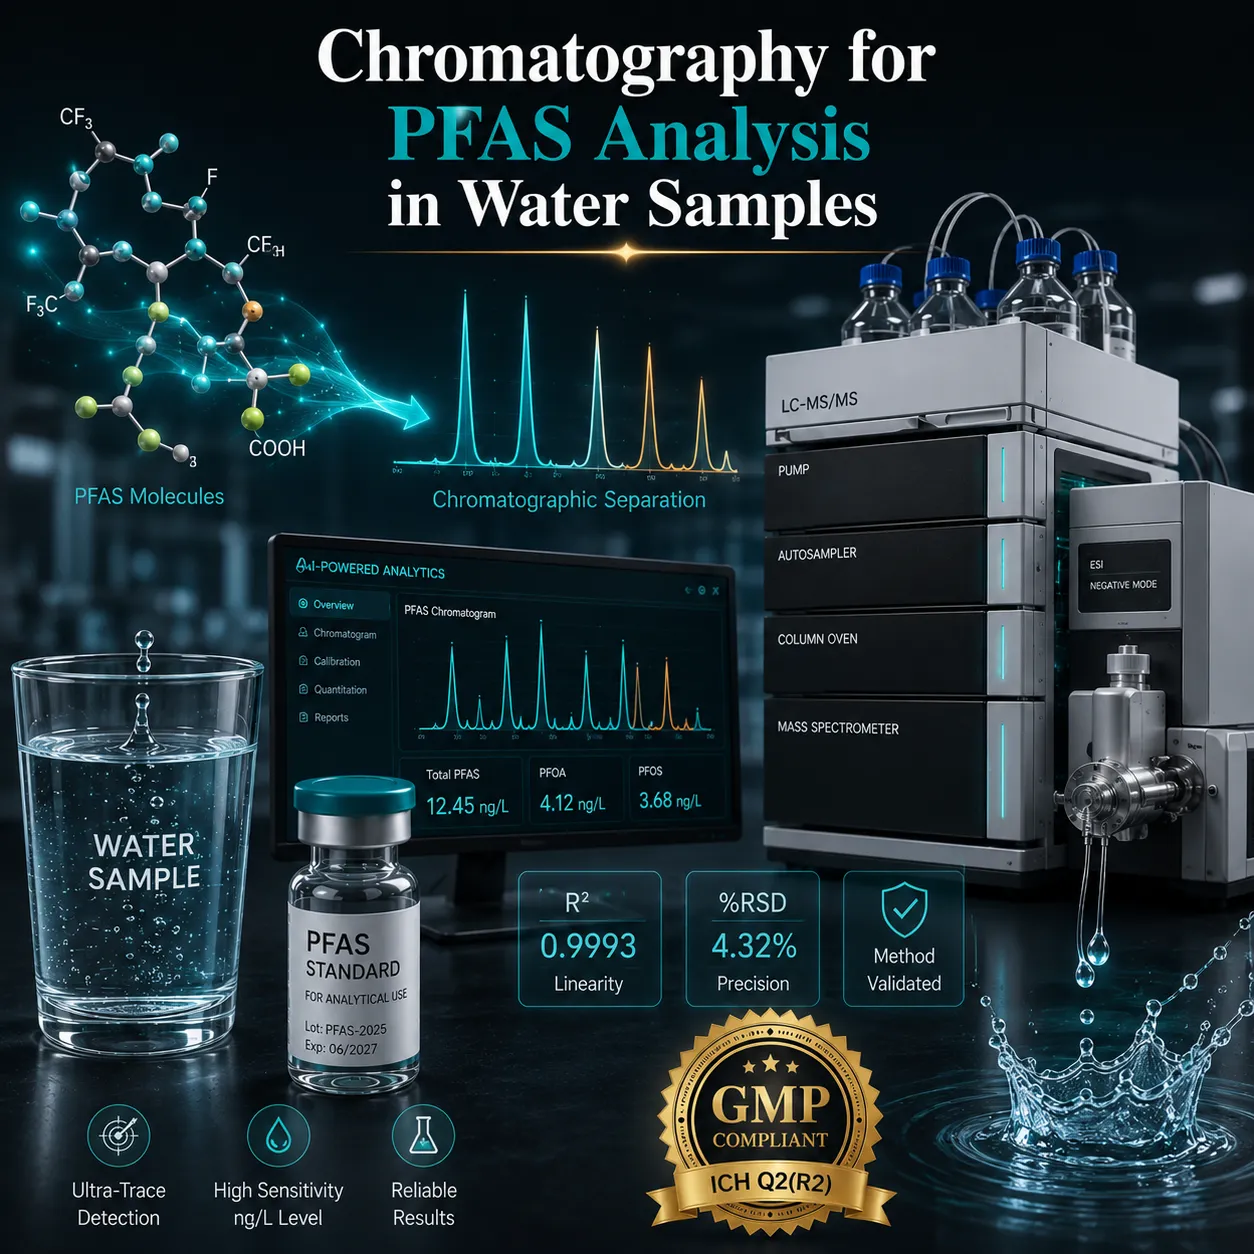
Chromatography for PFAS analysis in water samples uses solid-phase extraction (SPE) combined with LC-MS/MS to identify and quantify per- and polyfluoroalkyl substances at ultra-trace levels. This approach enables regulatory compliance, environmental monitoring, and risk assessment of persistent contaminants such as PFOA and PFOS.
Introduction
Per- and polyfluoroalkyl substances (PFAS), often called “forever chemicals,” have become one of the most significant environmental and public health concerns worldwide. Due to their exceptional chemical stability and widespread industrial use, PFAS persist in water sources, accumulate in ecosystems, and may contribute to adverse health outcomes including immune dysfunction, reproductive toxicity, and certain cancers.
As regulatory requirements become stricter, analytical laboratories require highly sensitive and selective methods capable of detecting PFAS at parts-per-trillion (ppt) concentrations. Today, Solid-Phase Extraction (SPE) coupled with Liquid Chromatography-Tandem Mass Spectrometry (LC-MS/MS) is considered the gold standard for PFAS analysis in drinking water.
A recent Hungarian study analyzing 32 drinking water samples demonstrated the effectiveness of SPE-LC-MS/MS for detecting 18 PFAS compounds, with detection limits as low as 0.2–1.0 ng/L and total PFAS concentrations ranging from 3.9 to 28.3 ng/L. PFOA and PFOS were detected in every sample, highlighting the global prevalence of PFAS contamination.
What Are PFAS?
PFAS comprise thousands of synthetic fluorinated compounds used in:
- Firefighting foams
- Electronics manufacturing
- Battery production
- Food packaging
- Textile coatings
- Cosmetics
- Industrial processing
Their strong carbon-fluorine bonds make them resistant to degradation, resulting in long-term environmental persistence.
Common PFAS Detected in Water
| PFAS Compound | Classification | Common Source |
|---|---|---|
| PFOA | Legacy PFAS | Industrial manufacturing |
| PFOS | Legacy PFAS | Firefighting foams |
| PFHxS | Sulfonate PFAS | Industrial applications |
| PFNA | Carboxylate PFAS | Chemical production |
| GenX (HFPO-DA) | Emerging PFAS | Fluoropolymer manufacturing |
| ADONA | Emerging PFAS | Industrial processing |
Why Chromatography Is Essential for PFAS Analysis
PFAS are typically present at extremely low concentrations, often below 10 ng/L.
Traditional analytical techniques lack the sensitivity required for accurate quantification.
Chromatography provides:
✅ Ultra-trace detection
✅ High selectivity
✅ Simultaneous multi-analyte screening
✅ Regulatory acceptance
✅ Quantitative accuracy
Gold Standard Method: SPE-LC-MS/MS
The most widely adopted workflow combines:
1. Solid-Phase Extraction (SPE)
SPE isolates and concentrates PFAS from large water volumes.
Benefits
- Matrix cleanup
- Improved sensitivity
- Reduced interference
Typical Sample Volume
| Method | Sample Volume |
|---|---|
| EPA 537.1 | 250 mL |
| EPA 533 | 100–250 mL |
2. LC-MS/MS Analysis
After extraction, analytes are separated by liquid chromatography and identified using tandem mass spectrometry.
Advantages
- High specificity
- Excellent sensitivity
- Multi-residue capability
- Confirmation through multiple ion transitions
Step-by-Step PFAS Analysis Workflow
Step 1: Sample Collection
Collect drinking water samples in polypropylene containers to minimize contamination.
Best Practice
Avoid PTFE-containing materials that may introduce PFAS background contamination.
Step 2: Sample Preservation
Store samples at 4–5°C and analyze within validated holding times.
Step 3: Solid-Phase Extraction
Samples are passed through weak anion exchange SPE cartridges.
Purpose
- Concentrate PFAS
- Remove matrix components
- Improve detection limits
Step 4: Elution and Concentration
PFAS are eluted using methanol-based solvents and concentrated under nitrogen.
Step 5: LC-MS/MS Analysis
Instrument Configuration
| Parameter | Typical Setting |
|---|---|
| Ionization | ESI Negative Mode |
| Detector | Triple Quadrupole MS |
| Injection Volume | 5 µL |
| Flow Rate | 0.4 mL/min |
| Run Time | ~16 minutes |
Step 6: Identification
Analytical criteria include:
- Retention time matching
- Product ion confirmation
- Ion ratio verification
- Signal-to-noise evaluation
Step 7: Quantification
Quantification is performed using:
- Internal standard calibration
- Isotope dilution methods
- Recovery monitoring
Method Performance Characteristics
Modern PFAS methods achieve exceptional analytical performance.
| Parameter | Performance |
|---|---|
| LOD | 0.2–1.0 ng/L |
| LOQ | 1–3 ng/L |
| Recovery | 88.4–128.4% |
| Precision | RSD <20% |
| Linearity | R² >0.99 |
These metrics satisfy requirements outlined in EPA and European guidance documents.
Regulatory Framework for PFAS Testing
EU Drinking Water Directive 2020/2184
Mandatory PFAS monitoring requirements apply across EU member states.
Regulatory Limits
| Parameter | Limit |
|---|---|
| Sum of 20 PFAS | 100 ng/L |
| Total PFAS | 500 ng/L |
Mandatory monitoring requirements are being progressively implemented throughout Europe.
US EPA Methods
EPA Method 537.1
- Covers 18 PFAS analytes
- SPE-based extraction
- LC-MS/MS detection
EPA Method 533
- Covers 25 PFAS analytes
- Includes emerging PFAS compounds
- Uses isotope dilution quantification
Practical Example: PFAS Monitoring in Drinking Water
A validated SPE-LC-MS/MS method was applied to 32 drinking water samples collected in Hungary.
Key Findings
| Finding | Result |
|---|---|
| Samples analyzed | 32 |
| PFAS compounds monitored | 18 |
| Detection rate | 100% |
| Total PFAS range | 3.9–28.3 ng/L |
| PFOA detected | All samples |
| PFOS detected | All samples |
The study represented the first comprehensive PFAS assessment in Hungarian drinking water and demonstrated that all samples remained below EU regulatory limits while still showing measurable PFAS contamination.
Risk Assessment of PFAS Exposure
The European Food Safety Authority (EFSA) established a tolerable weekly intake (TWI) of:
4.4 ng/kg Body Weight/Week
Based on:
- PFOA
- PFOS
- PFHxS
- PFNA
Hazard Quotient (HQ)
Risk assessments compare measured concentrations against toxicological thresholds.
Interpretation
| HQ Value | Risk Level |
|---|---|
| <1 | Acceptable |
| >1 | Potential concern |
This approach supports evidence-based public health decisions.
GMP and Regulatory Considerations
Pharmaceutical laboratories involved in environmental monitoring should implement GMP-inspired analytical controls.
Key Requirements
Method Validation
Follow:
- ICH Q2(R2)
- USP <1225>
- EPA validation guidelines
Data Integrity
Comply with:
- FDA 21 CFR Part 11
- ALCOA+ principles
- Audit trail requirements
Quality Control Measures
- Procedural blanks
- Field blanks
- Isotope-labeled standards
- Ongoing recovery monitoring
- Calibration verification
Analytical Challenges in PFAS Testing
Despite technological advances, several challenges remain.
Background Contamination
PFAS may originate from:
- Tubing
- Solvents
- Laboratory air
- Instrument components
Mitigation Strategy
Install PFAS delay columns and implement rigorous blank controls.
Matrix Effects
Water concentration procedures can amplify ion suppression effects.
Solution
Use isotope dilution calibration whenever possible.
Emerging PFAS Compounds
Thousands of PFAS variants remain poorly characterized.
Future methods must expand beyond targeted analysis toward:
- Total PFAS
- Extractable Organic Fluorine (EOF)
- Non-targeted screening
Future Trends in PFAS Chromatography
Emerging innovations include:
- High-resolution mass spectrometry (HRMS)
- Automated SPE systems
- AI-assisted data interpretation
- Non-targeted PFAS screening
- Total fluorine analysis
- Continuous environmental monitoring
These technologies will play a critical role as global PFAS regulations continue to evolve.
Conclusion
Chromatography remains the cornerstone of PFAS analysis in water samples. Combining Solid-Phase Extraction (SPE) with LC-MS/MS enables laboratories to detect PFAS at ultra-trace levels while meeting increasingly stringent regulatory requirements.
As monitoring programs expand globally and new PFAS compounds emerge, advanced chromatographic techniques will remain essential for environmental protection, public health surveillance, and regulatory compliance. The growing emphasis on total PFAS assessment and risk-based monitoring further reinforces the importance of robust, validated analytical methodologies.
FAQs
1. What is PFAS analysis in water samples?
PFAS analysis identifies and quantifies per- and polyfluoroalkyl substances in drinking and environmental water sources.
2. Which chromatography method is used for PFAS testing?
SPE coupled with LC-MS/MS is the gold standard for PFAS analysis.
3. Why are PFAS called forever chemicals?
Their strong carbon-fluorine bonds resist degradation, allowing them to persist in the environment for decades.
4. What are the most commonly detected PFAS compounds?
PFOA, PFOS, PFHxS, PFNA, GenX, and ADONA are among the most frequently monitored PFAS.
5. What detection limits can modern PFAS methods achieve?
Validated methods can achieve detection limits as low as 0.2–1.0 ng/L.
6. What is EPA Method 537.1?
It is a validated SPE-LC-MS/MS method for analyzing 18 PFAS compounds in drinking water.
7. What is EPA Method 533?
EPA 533 expands PFAS coverage to 25 analytes, including emerging compounds.
8. Why are isotope-labeled standards important?
They compensate for matrix effects and improve quantification accuracy.
9. What is the EU PFAS limit for drinking water?
The EU Drinking Water Directive sets a limit of 100 ng/L for the sum of 20 PFAS compounds.
10. What is the future of PFAS testing?
Future testing will focus on total PFAS measurement, non-targeted analysis, HRMS, and EOF methodologies.