


Learn how to calculate pharmaceutical shelf life from stability data using ICH Q1E, regression analysis, degradation kinetics, and confidence intervals.
Definition
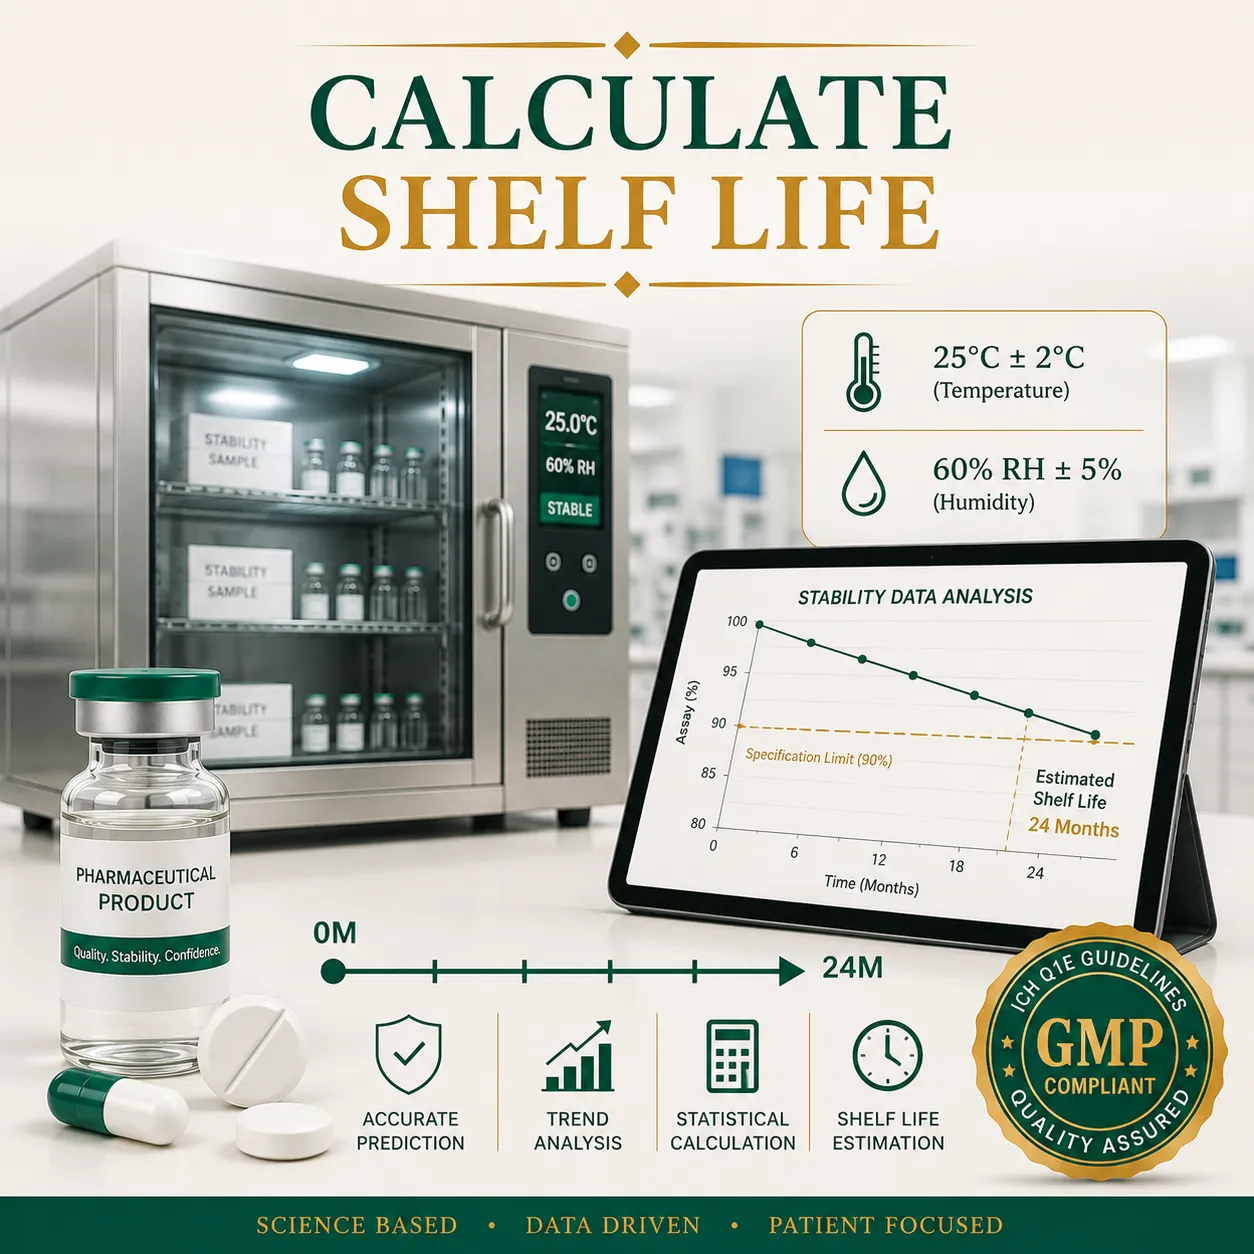
Pharmaceutical shelf life is calculated by analyzing stability data over time and determining when the product is expected to reach its specification limit. According to ICH Q1E, shelf life is established using regression analysis and the lower 95% confidence limit of the stability trend line, ensuring the product remains within approved quality specifications throughout its expiration period.
How to Calculate Pharmaceutical Product Shelf Life from Stability Data
Determining pharmaceutical shelf life is one of the most important objectives of a stability program. Regulatory authorities require scientific evidence that a drug product maintains its identity, strength, quality, purity, and performance throughout its labeled expiration period.
Shelf-life determination is not based on simple averages or visual observations. Instead, it relies on statistical evaluation of stability data generated under long-term and accelerated storage conditions.
Modern pharmaceutical shelf-life calculations follow ICH Q1E Evaluation of Stability Data, which provides a standardized framework for trend analysis, confidence intervals, and expiration dating justification.
This guide explains the scientific principles, calculations, statistical methods, and regulatory expectations used to establish pharmaceutical product shelf life.
What Is Pharmaceutical Shelf Life?
Shelf life is the period during which a pharmaceutical product remains within approved specifications when stored under recommended conditions.
During this period, the product must maintain:
- Potency (assay)
- Dissolution performance
- Physical integrity
- Microbiological quality
- Impurity levels
- Appearance
Shelf Life vs Expiration Date
| Term | Definition |
|---|---|
| Shelf Life | Scientifically justified storage period |
| Expiration Date | Calendar date assigned based on shelf-life data |
Example:
- Manufacturing Date: January 2026
- Approved Shelf Life: 24 Months
Expiration Date:
- January 2028
Regulatory Basis for Shelf-Life Determination
Key Guidelines
| Guideline | Purpose |
|---|---|
| ICH Q1A(R2) | Stability study requirements |
| ICH Q1E | Stability data evaluation |
| FDA Guidance on Stability Testing | Shelf-life determination |
| WHO Stability Guidelines | Global stability requirements |
| EU GMP Annex 15 | Qualification and validation support |
Pharmaceutical Shelf Life Calculator
Calculate t90 (time to 90% potency), degradation rate constants, and estimate shelf life from stability data.
1. First-Order Shelf Life (t90) Calculator
Formula: t90 = 0.105 / k
2. First-Order Degradation Rate Constant (k)
Formula: k = [ln(A₀) – ln(A)] / t
3. Zero-Order Shelf Life Calculator
Formula: t90 = (A₀ − 0.9A₀) / k
4. Shelf Life from Regression Line
Formula: Shelf Life = (Intercept − Specification Limit) / |Slope|
5. Arrhenius Equation Calculator
Formula: k = A × e^(-Ea / RT)
Step 1: Identify Product Specification Limits
Shelf life is determined by evaluating when a critical quality attribute reaches its specification limit.
Typical Acceptance Criteria
| Parameter | Example Specification |
|---|---|
| Assay | 90–110% Label Claim |
| Dissolution | ≥ 80% Released |
| Total Impurities | ≤ 2.0% |
| Individual Impurity | ≤ 0.5% |
| Water Content | Within approved limits |
Example
Assay specification:
- Initial Potency = 100%
- Lower Specification Limit = 90%
Shelf life ends when statistical analysis predicts potency may fall below 90%.
Step 2: Determine Degradation Kinetics
Drug degradation typically follows either:
- Zero-order kinetics
- First-order kinetics
Understanding degradation behavior is essential for predicting future product performance.
Zero-Order Degradation
The degradation rate remains constant over time.
Equation
A=A0−kt
Where:
- A = Remaining concentration
- A₀ = Initial concentration
- k = Degradation rate constant
- t = Time
First-Order Degradation
The degradation rate depends on the concentration remaining.
Equation
ln(A)=ln(A0)−kt
Where:
- A = Concentration at time t
- A₀ = Initial concentration
- k = Rate constant
Many pharmaceutical products exhibit first-order degradation behavior.
Step 3: Calculate the Degradation Rate Constant (k)
The degradation rate constant is obtained from the slope of the stability trend.
Example Stability Data
| Time (Months) | Assay (%) |
|---|---|
| 0 | 100.0 |
| 3 | 99.4 |
| 6 | 98.8 |
| 9 | 98.1 |
| 12 | 97.5 |
Regression analysis generates a degradation slope representing k.
Example
Regression slope:k=0.0085month−1
Step 4: Calculate t90
The most common shelf-life estimate is t90, the time required for potency to decline to 90% of the initial value.
For first-order degradation:t90=k0.105
Example Calculation
Given:k=0.0045month−1
Calculation:t90=0.00450.105 t90=23.3months
Estimated shelf life:
23 months
Step 5: Apply Statistical Analysis According to ICH Q1E
Regulators do not accept shelf-life determination based solely on average degradation trends.
Statistical evaluation must account for:
- Batch variability
- Analytical variability
- Confidence intervals
Why Confidence Intervals Matter
A product may appear stable based on average results but still fail due to uncertainty in the data.
ICH Q1E requires a conservative approach.
Regulatory Approach
Perform:
- Linear regression
- Trend analysis
- Poolability assessment
- Confidence interval calculations
Shelf life is assigned where:
Lower 95% Confidence Limit
intersects
Lower Specification Limit
Example of ICH Q1E Shelf-Life Determination
Stability Data
| Month | Mean Assay (%) |
|---|---|
| 0 | 100.0 |
| 6 | 99.0 |
| 12 | 98.2 |
| 18 | 97.4 |
| 24 | 96.6 |
Regression predicts:
- Mean reaches 90% at 40 months
However:
- Lower 95% confidence limit reaches 90% at 36 months
Assigned Shelf Life
36 Months
This conservative estimate protects product quality and patient safety.
Shelf-Life Determination Using Multiple Batches
ICH Q1E recommends evaluating multiple registration batches.
Example
| Batch | 24-Month Assay |
|---|---|
| Batch A | 96.5% |
| Batch B | 96.9% |
| Batch C | 96.2% |
Statistical analysis determines:
- Whether data can be pooled
- Whether degradation rates differ significantly
Pooling improves shelf-life estimation accuracy when justified.
Step 6: Use Accelerated Stability Data and Arrhenius Modeling
Accelerated studies help predict degradation rates at normal storage conditions.
Accelerated Conditions
| Condition | Temperature | RH |
|---|---|---|
| Accelerated | 40°C ± 2°C | 75% RH ± 5% |
| Intermediate | 30°C ± 2°C | 65% RH ± 5% |
| Long-Term | 25°C ± 2°C | 60% RH ± 5% |
Arrhenius Equation
k=Ae−Ea/RT
Where:
| Variable | Meaning |
|---|---|
| k | Degradation rate constant |
| A | Frequency factor |
| Ea | Activation energy |
| R | Gas constant |
| T | Absolute temperature |
Why Arrhenius Modeling Is Used
Allows prediction of:
- Long-term degradation
- Shelf-life behavior
- Temperature sensitivity
without waiting years for real-time data.
When Intermediate Testing Is Required
ICH requires intermediate testing when accelerated studies show significant change.
Significant Change Examples
| Observation | Trigger |
|---|---|
| Assay loss > 5% | Yes |
| Dissolution failure | Yes |
| Impurity failure | Yes |
| Appearance change | Yes |
Intermediate conditions:
30°C ± 2°C / 65% RH ± 5%
help determine actual stability behavior.
Practical Example: Immediate-Release Tablet
Stability Results
| Time | Assay |
|---|---|
| Initial | 100.0% |
| 6 Months | 99.2% |
| 12 Months | 98.4% |
| 24 Months | 96.9% |
Regression Analysis
Predicted t90:
38 months
95% Confidence Limit
Predicted limit reaches 90% at:
36 months
Assigned Shelf Life
36 Months
Regulatory shelf life is based on the confidence limit, not the average trend.
GMP Considerations for Shelf-Life Assignment
Regulatory Expectations
Manufacturers must ensure:
- Stability protocols are approved
- Analytical methods are validated
- Data integrity is maintained
- Trend analyses are documented
- Statistical methods are justified
- OOS investigations are completed
Common Inspection Findings
| Deficiency | Risk |
|---|---|
| Unsupported shelf-life claims | Regulatory action |
| Missing statistical evaluation | Data rejection |
| Inadequate trend analysis | Shelf-life reduction |
| Poor data integrity | Warning letters |
| Insufficient batch data | Approval delays |
Step-by-Step Guide to Calculate Shelf Life
Step 1
Define product specifications.
Step 2
Generate long-term and accelerated stability data.
Step 3
Determine degradation kinetics.
Step 4
Calculate degradation rate constant (k).
Step 5
Perform regression analysis.
Step 6
Construct the 95% confidence interval.
Step 7
Identify where the lower confidence limit intersects the specification limit.
Step 8
Assign expiration dating period.
Step 9
Continue ongoing stability monitoring.
Step 10
Update shelf-life justification when additional data become available.
Best Practices Checklist
| Best Practice | Status |
|---|---|
| Three registration batches evaluated | ✓ |
| Long-term data generated | ✓ |
| Accelerated studies completed | ✓ |
| Statistical analysis performed | ✓ |
| ICH Q1E methodology followed | ✓ |
| Confidence intervals calculated | ✓ |
| Shelf life scientifically justified | ✓ |
| Trend analysis documented | ✓ |
| Ongoing stability program active | ✓ |
| GMP documentation maintained | ✓ |
FAQs
1. What is pharmaceutical shelf life?
Pharmaceutical shelf life is the period during which a drug product remains within approved quality specifications under recommended storage conditions.
2. How is shelf life calculated from stability data?
Shelf life is calculated using regression analysis and the lower 95% confidence limit of stability data according to ICH Q1E.
3. What is t90 in pharmaceutical stability studies?
t90 is the time required for a product to degrade to 90% of its initial potency.
4. Why is the 95% confidence limit used?
It provides a conservative estimate that accounts for analytical and batch-to-batch variability.
5. What is the role of ICH Q1E?
ICH Q1E provides guidance for statistical evaluation and shelf-life determination using stability data.
6. What is the Arrhenius equation used for?
It predicts degradation rates and shelf life based on temperature-dependent reaction kinetics.
7. How many batches are required for shelf-life determination?
Typically three representative batches are used for registration stability studies.
8. Can accelerated stability data establish shelf life?
Accelerated data can support predictions, but long-term data are generally required for regulatory approval.
9. What causes shelf-life reductions?
Excessive degradation, impurity growth, dissolution failures, or inadequate statistical support.
10. What is shelf-life extrapolation?
Shelf-life extrapolation extends expiration dating beyond available long-term data when scientifically justified.