


Learn how to interpret HPLC chromatograms correctly, including retention time, peak area, resolution, tailing, system suitability, and GMP insights.
Definition
To interpret an HPLC chromatogram correctly, evaluate the retention time (tR) for compound identification, peak area or height for quantification, baseline stability for system performance, and peak shape for chromatographic quality. System suitability parameters such as resolution, tailing factor, and theoretical plates should also be assessed before reporting results.
High-Performance Liquid Chromatography (HPLC) is one of the most widely used analytical techniques in pharmaceutical quality control, method validation, stability studies, and impurity testing. However, generating a chromatogram is only the first step. The real value comes from correctly interpreting the chromatographic data.
A poorly interpreted chromatogram can lead to inaccurate assay results, missed impurities, Out-of-Specification (OOS) investigations, and regulatory observations. Whether you’re a QC analyst, validation scientist, or pharmaceutical researcher, understanding chromatogram interpretation is essential for reliable decision-making.
This guide explains how to analyze HPLC chromatograms systematically and accurately.
What Is an HPLC Chromatogram?
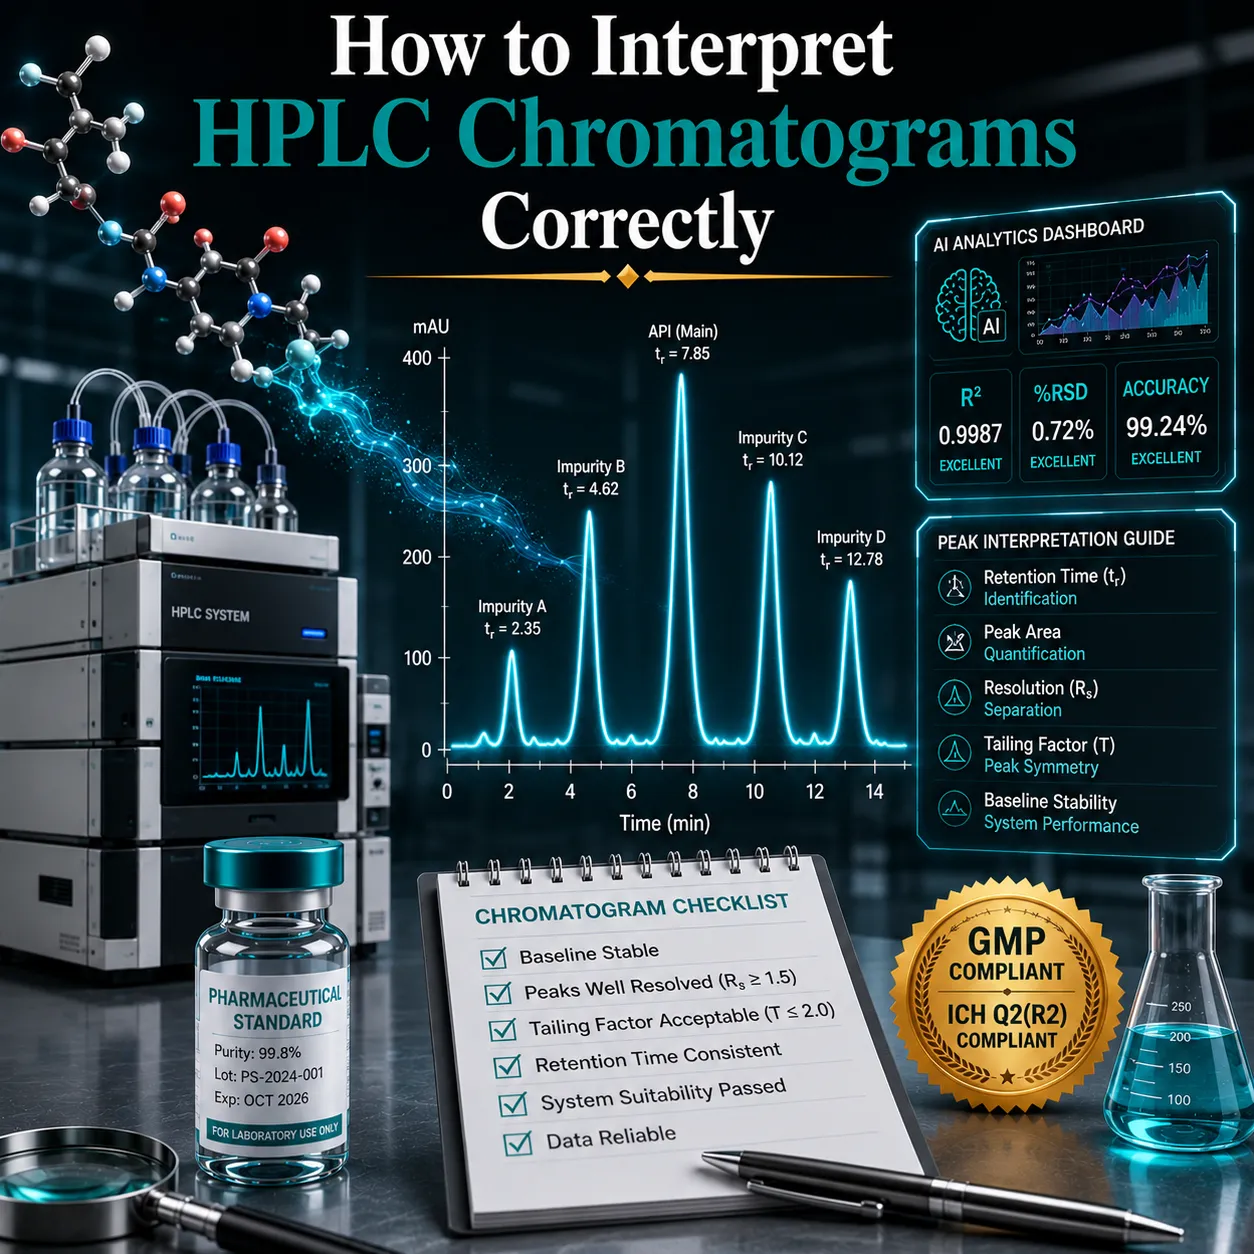
An HPLC chromatogram is a graphical representation of detector response versus time.
Each peak represents a compound eluting from the chromatographic column and being detected by the detector.
Basic Components
| Component | Description |
|---|---|
| X-Axis | Retention Time (tR) |
| Y-Axis | Detector Response |
| Peak | Eluted compound |
| Baseline | Detector signal without analyte |
Understanding the X-Axis: Retention Time (tR)
Retention time (tR) is one of the most important parameters in chromatographic analysis.
Definition
Retention time is the time required for a compound to travel from the injection point through the column and reach the detector.
Why Retention Time Matters
- Identifies compounds
- Confirms analyte presence
- Detects unexpected peaks
- Supports impurity profiling
Example
| Compound | Retention Time |
|---|---|
| API | 8.5 min |
| Impurity A | 5.2 min |
| Impurity B | 11.4 min |
If the API standard consistently elutes at 8.5 minutes, a peak appearing at this retention time strongly suggests the presence of the API.
Understanding the Y-Axis: Detector Response
The detector response reflects the amount of analyte reaching the detector.
Common Detector Outputs
- UV Absorbance
- Fluorescence Intensity
- Conductivity
- Refractive Index
Key Rule
The larger the peak area, the greater the quantity of analyte present.
Peak Area vs Peak Height
Both measurements provide information about analyte concentration.
Peak Area
Most pharmaceutical methods use peak area because it is less sensitive to peak broadening.
Advantages
✅ Better quantitative accuracy
✅ Preferred for assays
✅ Better reproducibility
Peak Height
Measures the maximum detector response.
Advantages
✅ Simple calculation
✅ Useful for sharp peaks
Limitations
More affected by peak shape variations.
Comparison Table
| Parameter | Peak Area | Peak Height |
|---|---|---|
| Quantitative Accuracy | Excellent | Moderate |
| Precision | High | Lower |
| Regulatory Preference | Preferred | Limited |
Baseline Evaluation: The Foundation of Reliable Results
The baseline is the detector signal observed when no analyte is eluting.
Ideal Baseline Characteristics
✅ Flat
✅ Stable
✅ Noise-free
Example of Good Baseline
_________________________Baseline Noise
Small random fluctuations in detector response.
Common Causes
- Air bubbles
- Mobile phase contamination
- Detector instability
- Poor degassing
Impact
Reduced sensitivity and inaccurate quantification.
Baseline Drift
Gradual upward or downward movement.
Common Causes
| Cause | Example |
|---|---|
| Temperature variation | Oven instability |
| Gradient changes | Mobile phase mismatch |
| Detector issues | Lamp aging |
Evaluating Peak Shape
Peak shape provides critical information about method performance.
Symmetrical Peak
Ideal chromatographic peak.
/\ / \ / \Indicates
- Healthy column
- Proper method conditions
- Reliable quantification
Peak Tailing
Peak extends excessively on the trailing side.
/\ / \ / \____Possible Causes
- Column contamination
- Active silanol interactions
- Incorrect pH
- Dead volume
GMP Impact
May result in SST failure.
Peak Fronting
Peak leans forward.
____/ /Possible Causes
- Sample overload
- Excessive injection volume
- Column overload
Understanding Resolution (Rs)
Resolution measures how well two adjacent peaks are separated.
Interpretation
| Resolution Value | Meaning |
|---|---|
| <1.0 | Poor separation |
| 1.0–1.5 | Partial separation |
| ≥1.5 | Baseline separation |
| >2.0 | Excellent separation |
Example
A resolution of 1.8 between an API and impurity peak generally indicates acceptable separation.
Evaluating System Suitability
Before interpreting any chromatogram, verify that system suitability requirements have passed.
Common SST Parameters
| Parameter | Purpose |
|---|---|
| Resolution | Peak separation |
| Tailing Factor | Peak symmetry |
| Plate Count | Column efficiency |
| %RSD | Injection precision |
| Retention Time | Consistency |
USP <621> requires system suitability compliance before sample analysis.
Step-by-Step Guide to Interpreting an HPLC Chromatogram
Step 1: Verify System Suitability
Confirm:
- Resolution passes
- %RSD meets criteria
- Tailing factor acceptable
Step 2: Assess Baseline Quality
Check for:
- Noise
- Drift
- Unexpected fluctuations
Step 3: Identify Peaks
Compare retention times with:
- Reference standards
- Previous validated runs
- Method specifications
Step 4: Evaluate Peak Shape
Look for:
- Tailing
- Fronting
- Splitting
- Broadening
Step 5: Review Peak Areas
Use calibrated standards and response factors.
Step 6: Confirm Quantification
Calculate concentration using:
- External standard method
- Internal standard method
- Calibration curve
Practical Example: Assay Chromatogram Interpretation
Scenario
Paracetamol assay chromatogram
| Peak | Retention Time | Area |
|---|---|---|
| Impurity A | 4.1 min | 3,250 |
| Paracetamol | 8.5 min | 1,254,800 |
| Impurity B | 11.2 min | 1,850 |
Interpretation
- API identified at 8.5 min
- Impurity peaks separated adequately
- Baseline stable
- Peak symmetry acceptable
- Quantification can proceed
Result:
Chromatogram is suitable for analysis.
Common Chromatogram Problems and Their Interpretation
| Observation | Possible Cause |
|---|---|
| Peak Tailing | Column contamination |
| Peak Fronting | Sample overload |
| Peak Splitting | Injection issues |
| Broad Peaks | Column deterioration |
| Baseline Noise | Air bubbles |
| Baseline Drift | Gradient instability |
| Extra Peaks | Contamination |
GMP and Regulatory Insights
Chromatographic interpretation is frequently reviewed during regulatory inspections.
Relevant Guidelines
- USP <621>
- ICH Q2(R2)
- FDA Data Integrity Guidance
- EU GMP Annex 11
Common Inspection Findings
❌ Unjustified peak integration
❌ Ignoring SST failures
❌ Inadequate chromatographic review
❌ Poor documentation of anomalies
Best Practices for Data Integrity
Ensure:
✅ Audit trails remain enabled
✅ Integration events are documented
✅ Peak assignments are justified
✅ Raw chromatograms are archived
✅ Electronic records are secure
Expert Tips for Accurate Chromatogram Interpretation
Always
- Compare with standards
- Review SST results
- Evaluate baseline first
- Confirm retention times
- Verify peak shape
Never
- Ignore unknown peaks
- Override integrations without justification
- Report results when SST fails
- Assume peak identity without standard comparison
FAQs
1. What does retention time mean in HPLC?
Retention time is the time required for a compound to travel through the column and reach the detector.
2. Why is peak area important in HPLC?
Peak area is directly proportional to analyte concentration and is commonly used for quantification.
3. What causes peak tailing in HPLC?
Common causes include column contamination, pH issues, and active silanol interactions.
4. What is baseline noise?
Baseline noise refers to random fluctuations in detector response when no analyte is present.
5. What is an acceptable resolution value?
A resolution value of 1.5 or greater generally indicates baseline separation.
6. Why is system suitability important?
System suitability confirms that the chromatographic system is performing correctly before analysis.
7. What causes peak fronting?
Peak fronting is usually caused by sample overload or excessive injection volume.
8. How are compounds identified in an HPLC chromatogram?
By comparing retention times with known reference standards.
9. What is peak splitting?
Peak splitting occurs when a single compound appears as multiple peaks due to injection or column issues.
10. Why is a flat baseline important?
A stable baseline ensures accurate peak integration and reliable quantification.